How satellites help keep agricultural research going during Covid-19 pandemic
Thursday, 18 June, 2020
With hundreds of millions of people around the world under some form of lockdown due to the Covid-19 pandemic, our society and economy has been dramatically impacted by the lack of human mobility. Businesses have gone under, employees laid off or furloughed, major events cancelled or postponed, and many economic activities around the world have ground to a halt.
Being an international organization with projects in different countries, ICBA has also had to adapt to the new ways of remote work due to travel and other restrictions. Much of our work relies on partnerships with local researchers, farmers and other stakeholders in these countries. Field-based research activities make up most of this work aimed at promoting climate-resilient and resource-efficient crops and technologies. Without the ability of our partners and our scientists to travel to project areas and plant crops, collect soil and waters, train farmers and extension workers, it has become more challenging to implement projects and extend support to our stakeholders.
While field-based activities have been limited to a certain extent, our geoinformatics and modelling team has continued its work as usual as it predominantly requires data that does not involve ground-level tasks. We rely on the decades of data provided freely by the European Space Agency, the United States Geological Survey, NASA, and other organizations; we employ troves of spatial data that have already been collected and are stored in repositories across the internet. We also use climatic data that is generated hourly by earth-orbiting satellites that continue to relay this data to scientific organizations around the world. Our work is supported by data that is generated by equipment that largely runs without the need for much field-level calibration; equipped with the software, our laptops can serve as our workplace. This allows us to carry on vital work and analysis without being impeded by the current situation.
This type of research has numerous applications during crises. The Red Cross and Open Street Map frequently collaborate to use GIS technologies during disaster events to pinpoint target areas for rescue operations. FEWSNET, a US government platform, uses several geospatial modelling tools to predict famine in marginal regions of the world. John Hopkins University and ESRI are currently applying these GIS technologies to map and track the Covid-19 outbreak.
These technologies, which have proven essential for the management of agriculture, the environment, and climate before the current pandemic, are proving even more vital now; we need more solutions that can generate and analyze data remotely without compromising the quality of outputs. Given the disruption to the flow of goods, services and people, there is a concern about the impacts this will have on food security and agriculture around the world. GIS and remote-sensing technologies can be deployed during this period for a wide range of purposes. For example, by using key bands from satellite imagery and specific indices relevant to vegetation, the remote monitoring of agricultural areas can be conducted. This will make it possible to monitor farms and agricultural areas around the world without the need for data collection on the ground. By analyzing farmed areas across the growing seasons in different years, changes to yield productivity and the total area farmed can be monitored and analyzed. Techniques like this can provide insight into how changes in the socioeconomic landscapes from events like Covid-19 impact agriculture in any study area, while avoiding the costly and time-consuming process of field data collection, particularly in areas where Covid-19 is limiting the mobility of researchers and their access to agricultural areas.
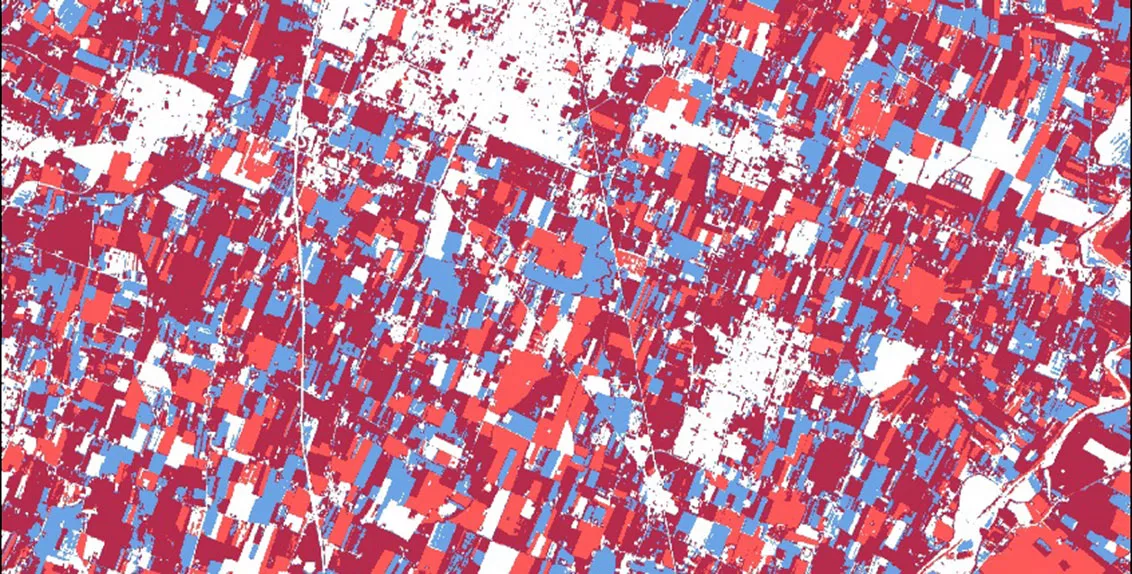
ICBA is committed to providing data-driven spatial analyses to support the management of lands, resources, and sustainable agriculture in marginal landscapes around the world. Our teams have developed models to monitor evapotranspiration, drought, vegetative productivity, and other key indices to better understand how environmental resources are utilized, as well as to flag any critical changes that could indicate losses in productivity and changes to the geoclimatic setting in key areas. Our work also involves drones, which facilitate small-scale high-resolution mapping of agricultural activities on individual farms. Moreover, with an ever-increasing expansion of drone capabilities and technologies, our scientists aim to explore the possibility of seeding, pollination, and farming using automated drone systems. And finally, our in-house GIS capabilities utilize all available open-source spatial data layers related to global vegetative cover to provide insight into the environment and agricultural productivity globally. For instance, available satellite imagery can be used to gain insight on the location and productivity of farms, as seen in the image below.
The tools available for spatial data analysis help our research team to ask and answer several key questions. Has the productivity in agricultural areas been affected by Covid-19 or other environmental or socioeconomic events? What are the changes to agricultural and natural flora over a time? How has climate change impacted marginal regions of the world, as deduced from the changes to climatic indices detected from drones, models, and satellite imagery? These questions and more can be answered by utilizing these cutting-edge technologies at ICBA. These technologies allow ICBA to continue the work we do in marginal environments and to remain competitive in the ever-growing landscape of technical and data-led analyses of global agriculture and natural landscapes.
While the world is faced with a crisis that has disrupted industries and lives, geoinformatics and modelling helps scientists continue doing their job. It may feel like much of the world has gone into hibernation, but satellites do not sleep.

